
My Projects
a collection of my technical and research work

Impact of the 2024 U.S. Presidential Election on Public Interest in Tariffs and Stock Markets: A Google Trends Analysis
Time-Series Forecasting & Public Attention AnalysisAnalyzed Google Trends search data (Jan 2022–Jan 2026) using five forecasting models (ARIMA, SARIMA, Holt's Trend, Holt's Winter, SES) to establish baseline attention levels, then measured how post‑election tariff search interest overshot its forecast by +55.12% versus +8.36% for stock search interest, and how correlation between the two topics rose from r=0.02 to r=0.81.
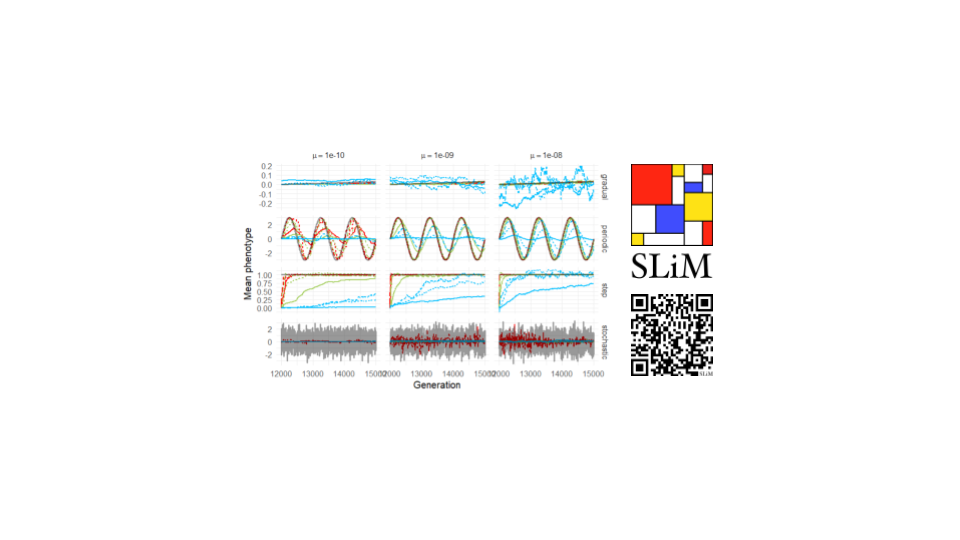
Analysis of Population Responses to Different Patterns of Environmental Change
Population Genetics Simulation & Evolutionary ModelingSimulated population adaptation in SLiM under four patterns of environmental change, gradual, periodic, step, and stochastic, across 108 combinations of selection strength and mutation parameters. Found that predictable environments (gradual, periodic) were far easier for populations to track than stochastic change, and that equal total mutational variance can still produce very different fitness outcomes depending on whether it came from frequent small mutations or rare large ones.
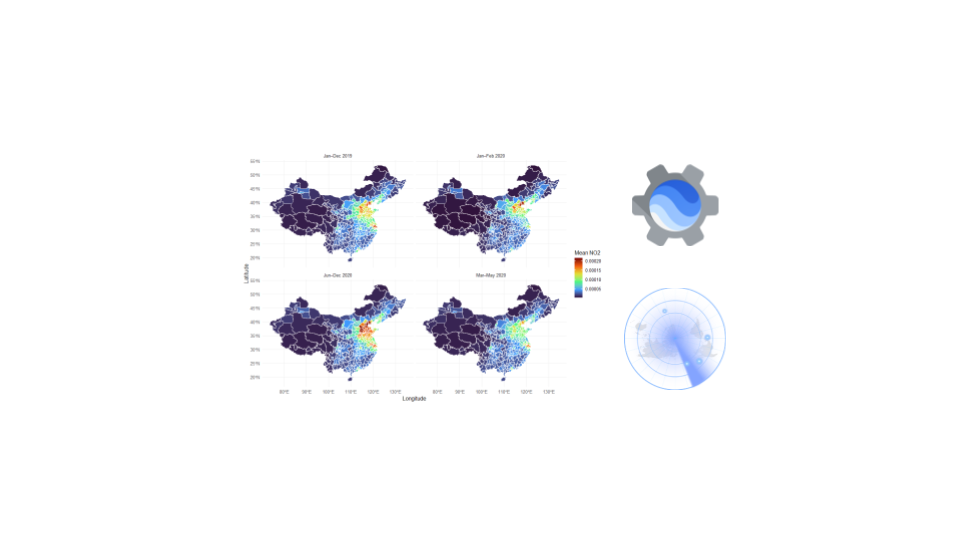
Assessing the Impact of Flight Activity on Urban NO₂ Pollution During The COVID-19 Pandemic in China
Spatial Analysis & Remote SensingAnalyzed flight trajectories from 58 major Chinese airports (Jan 2019–Dec 2020) alongside Sentinel-5P TROPOMI satellite data to quantify changes in urban NO₂ pollution across pre-COVID, disruption, and recovery phases.
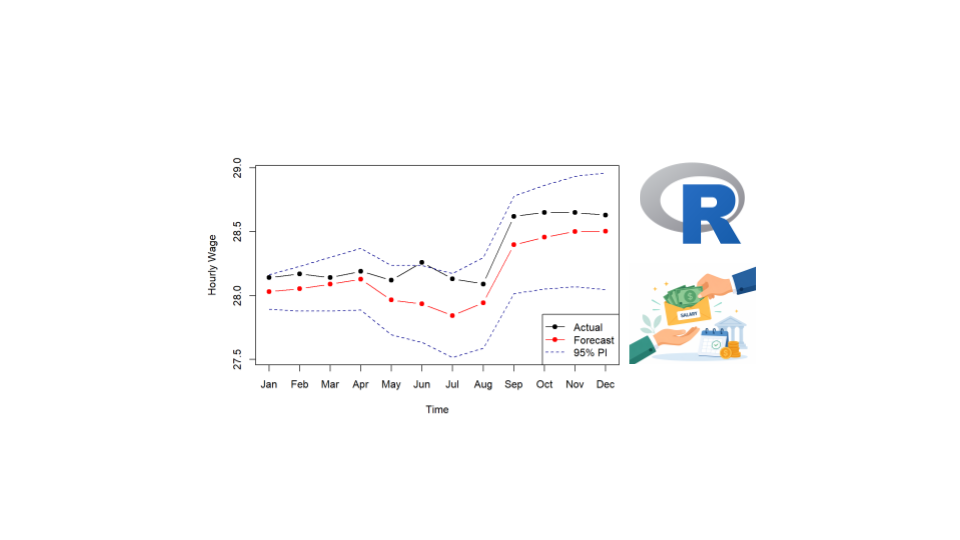
Forecasting Canadian Average Hourly Wages Using Time Series Models
Time Series Forecasting & Economic AnalysisModeled monthly average hourly wages in Canada (Jan 1997–Nov 2024) using three forecasting frameworks — seasonal decomposition with an ARMA-fitted remainder, SARIMA (Box-Jenkins), and Holt-Winters exponential smoothing — training on pre-pandemic data (1997–2018) and evaluating on a 2019 holdout period via Mean Squared Prediction Error. The decomposition-based model was most accurate (MSPE = 0.0135), ahead of SARIMA (0.0321) and Holt-Winters (0.0327).
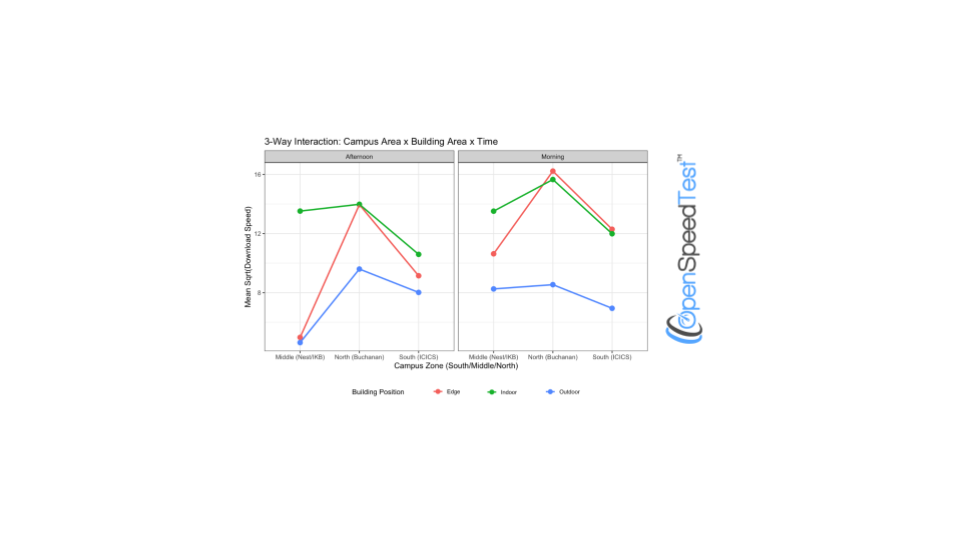
Investigating Factors Influencing Internet Speed on UBC Vancouver Campus
Factorial Design & Causal InferenceDesigned and ran a blocked factorial experiment measuring UBC's ubcsecure WiFi download speeds across campus building, building area (indoor/edge/outdoor), and time of day, treating speed test website as a blocking factor to isolate it from the effects of interest. ANOVA showed significant main effects of building, area, and time of day, plus significant interactions among all three, while device type, browser, and speed test website had no measurable effect, indicating the results reflect real network conditions rather than measurement artifacts.
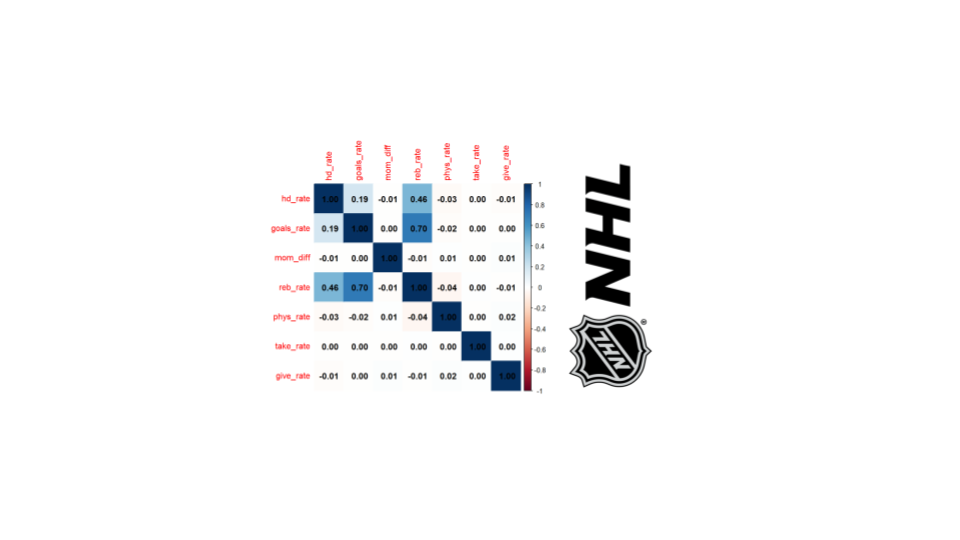
Panel Data Analysis of Interactive Effects between High-Danger Shots, Rebounds, and Secondary Skills on NHL Goal Production
Sports Analytics & Statistical ModelingAnalyzed five seasons of NHL player performance data (22,117 observations across 1,460 players) using fixed-effects panel regression in R to quantify how interactions between player skills influence goal production.